📈 TJ Account Statistics
Your professional trading dashboard and automated journal.
This tool brings your most critical account metrics directly onto your chart, so you never have to switch tabs or lose focus on price action. It tracks your performance in real-time and acts as an automated trading journal by exporting your trade history.

🚀 Key Features
- Real-Time PnL Tracking: Monitor Open, Realized, and Net PnL (after commissions) live on your chart.
- Flexible Filtering: View statistics for all instruments in your portfolio or isolate the current chart's symbol instantly.
- Session Control: Define your own history lookback. Review just today's session, the last week, or your entire account history.
- Risk Management: Keep an eye on your Drawdown and Win Rate to ensure you stay disciplined.
- Automated Journaling: Automatically exports your trade history to CSV when you close the session, complete with advanced metrics like MAE (Maximum Adverse Excursion) and MFE (Maximum Favorable Excursion).
- Replay Compatible: Fully functional in ATAS Market Replay mode for practicing and backtesting.
- Place the table freely on the screen with drag & drop
📥 Installation
- Go to License Management above and subscribe to the indicators you want.
- After subscribing, ATAS will automatically add the indicators to your profile
- Restart ATAS and press
Ctrl+I: all my indicators start with 'TJ ...'
⚙️ Settings Guide
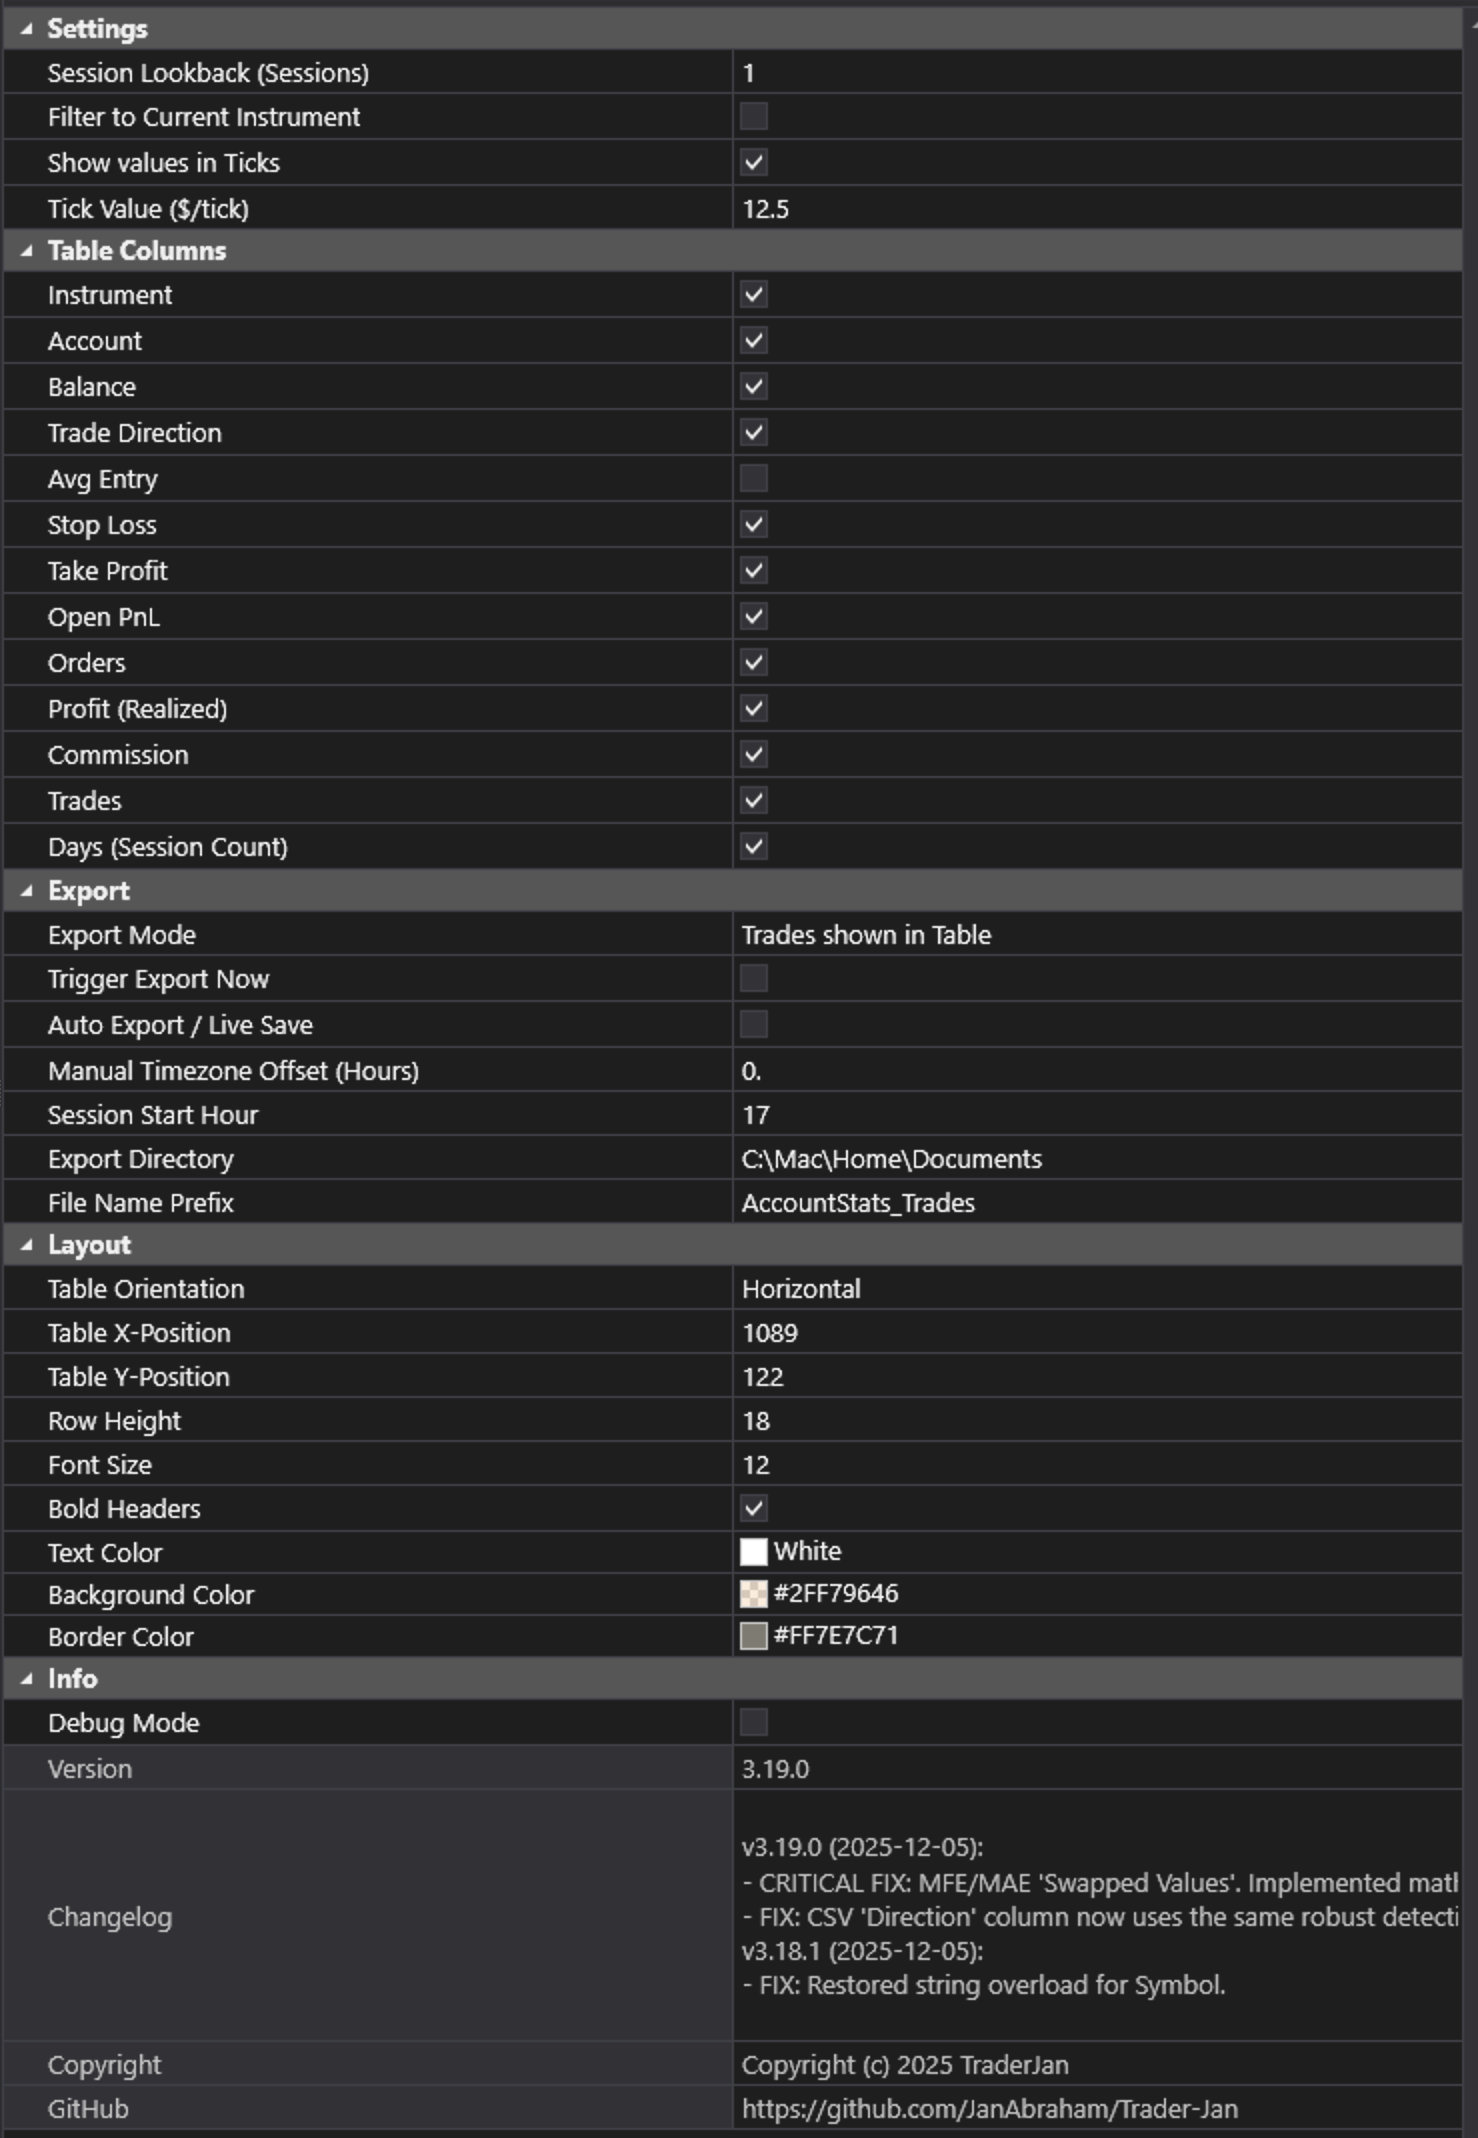
1. General Settings
- Filter to Current Chart:
Enabled: Shows metrics only for the symbol currently on your chart (e.g., if you are on NQ, you only see NQ stats).Disabled: Shows a summary of all trades in your account (Portfolio view).
- Session Lookback (Days): Determines how much history is included in the calculation.
0: Loads all available history.1: Loads today's session only.5: Loads the last week, etc.
- Account Filter: If you have multiple accounts connected (e.g., Sim, Prop, Live), select which one to track. Default is "All".
2. Display & Columns
Customize the dashboard to show only what you need. You can toggle visibility for:
- Show Ticks: Displays PnL values in Ticks instead of Currency.
- Standard Columns: Symbol, Side (Long/Short), Size (Position).
- Price Levels: Entry Price, Current Price, Stop Loss (SL), Take Profit (TP).
- Performance Metrics:
- Open PnL: Your floating profit/loss for active positions.
- Realized PnL: Locked-in profit/loss from closed trades.
- Commission: Estimated trading costs.
- Net PnL: Total PnL minus Commissions (The "Real" number).
- Drawdown: The maximum drawdown experienced during the session.
- Win Rate: Your % of profitable trades.
3. Export (Auto-Journal)
Turn your manual trading into data you can analyze.
* Auto Export: When enabled, the indicator will automatically save a .csv file every time a trade is closed (very helpful in Replay mode).
* Export Button: Manually trigger an export at any time.
* Export Directory: Choose where to save the files on your PC (Default: C:\TraderJan\Exports).
💡 Note: The exported CSV contains more detailed data than the screen, including entry/exit times, duration, and MAE/MFE stats for deep analysis in Excel or other journals.
4. Layout & Visuals
- Orientation: Choose between a
Vertical(list) orHorizontal(bar) layout to fit your screen setup. - Visual Customization: Adjust font sizes, row heights, and colors for Positive/Negative PnL to match your chart theme.